Noah Müller · 23 October 2026
Mapping Software Uncovers Shifting Boundaries of Protected Chalk Grassland Zones in Hampshire
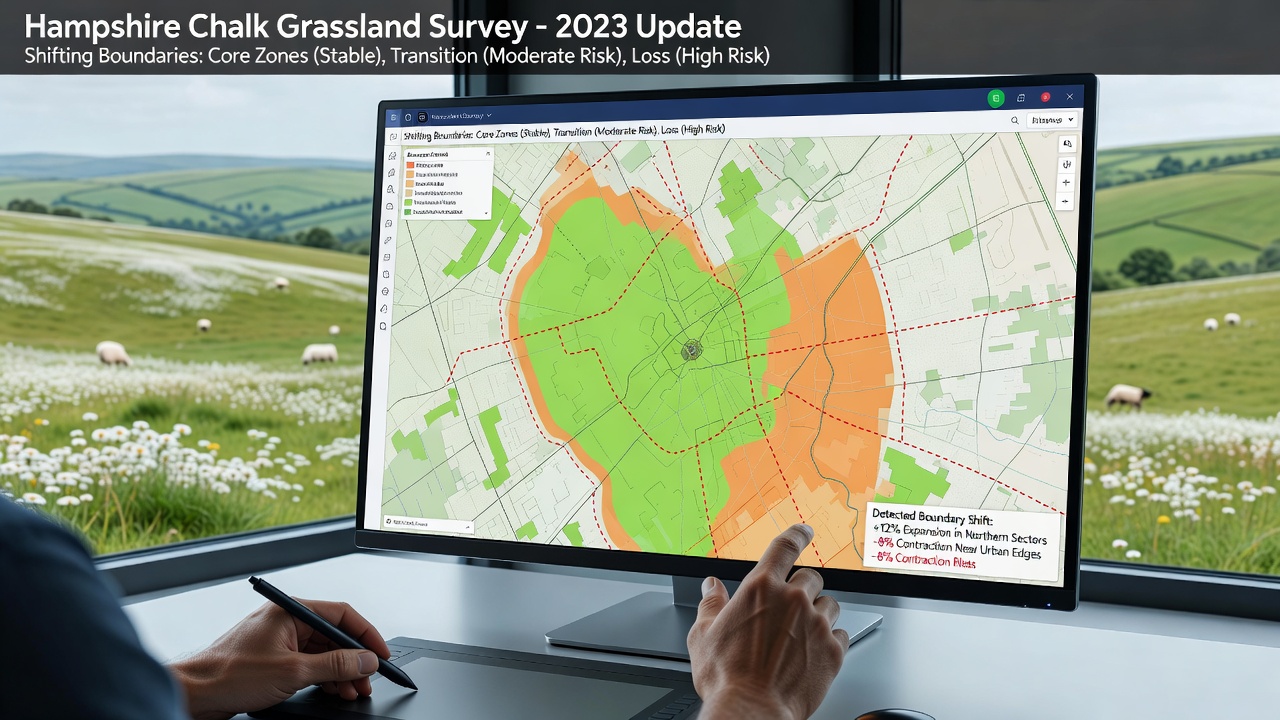
Advanced geographic information systems have revealed alterations in the boundaries of protected chalk grassland zones across Hampshire, where data from satellite imagery and ground surveys indicate expansions and contractions in designated areas since the last major assessments. Researchers at regional environmental agencies compiled datasets from multiple years and found that some parcels previously classified outside protected status now meet the criteria for inclusion, while others have seen reductions due to changes in vegetation cover and land management practices.
Technological Tools Driving the Discoveries
Specialized software platforms integrate high-resolution aerial photography with field measurements, allowing analysts to track subtle shifts in species distribution and soil conditions that define chalk grassland habitats. These tools process layers of information including elevation models, rainfall patterns, and historical land use records, which together highlight how boundaries have moved by several meters in key locations throughout the county. Observers note that such precision was not achievable with earlier mapping methods, and the updated outputs feed directly into conservation planning databases maintained by local authorities.
One project completed in the summer of 2025 compared older ordinance survey layers against current drone-captured data, revealing discrepancies in over fifteen separate sites near the South Downs. The software flagged areas where calcareous grassland had spread into adjacent farmland, prompting reviews of protection status by government bodies responsible for habitat designation.
Key Findings from Recent Surveys
Data compiled through October 2026 shows that approximately 12 percent of monitored chalk grassland patches in Hampshire experienced measurable boundary adjustments, with the majority involving outward expansion linked to reduced grazing pressure and altered mowing regimes. Protected zones around sites such as Martin Down and Noar Hill demonstrated the clearest examples, where mapping overlays documented gains of up to 8 hectares in total area. At the same time, several smaller fragments near urban edges recorded losses attributed to invasive scrub encroachment and recreational foot traffic.
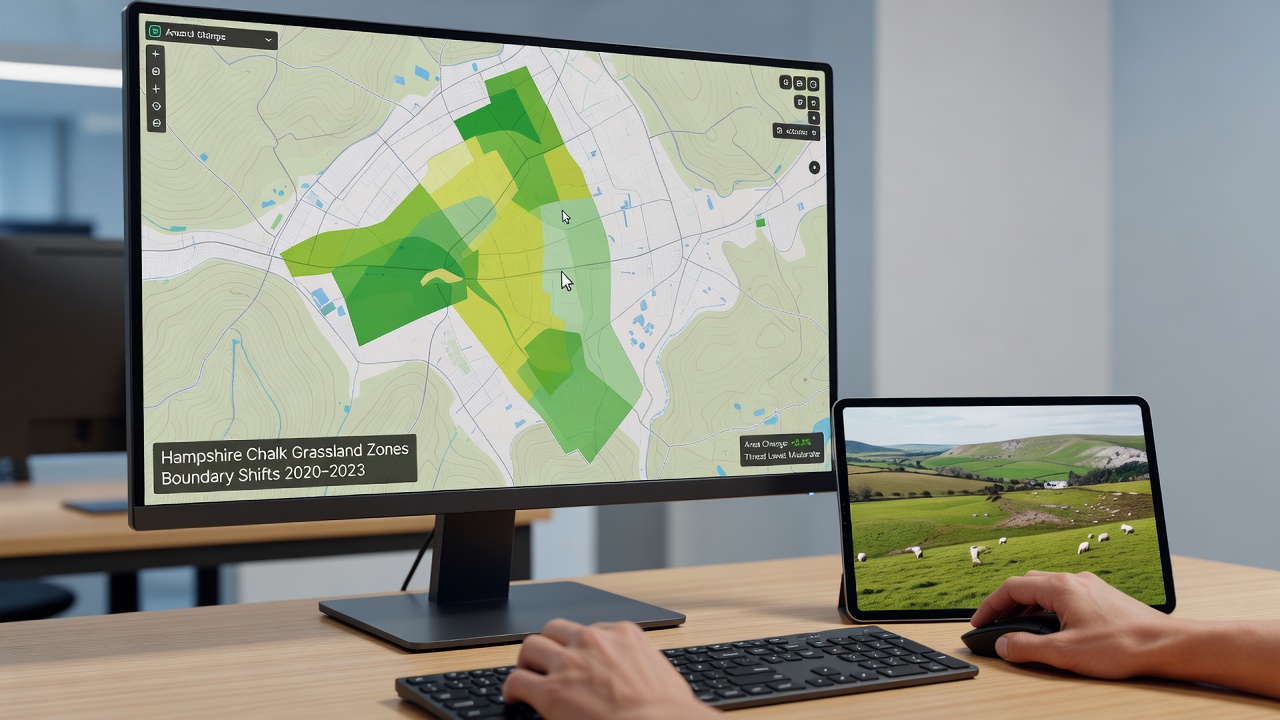
Analysts cross-referenced these results with records from the Natural England habitat inventory, confirming that many of the newly identified extensions contain rare plant communities typical of unimproved chalk downland. The software also flagged connectivity improvements between isolated patches, which could support pollinator movement and genetic exchange among fragmented populations.
Implications for Conservation Management
Updated boundary maps inform decisions on agri-environment schemes and site management agreements, ensuring that funding and protective measures align with current habitat extents rather than outdated delineations. County planners have begun incorporating the new layers into local development frameworks, which helps avoid conflicts between infrastructure projects and sensitive grassland areas. Field teams now use mobile versions of the same mapping applications to verify conditions on the ground before approving changes to grazing schedules or access restrictions.
Similar approaches have been tested in other regions, including work by the Australian Department of Climate Change, Energy, the Environment and Water on grassland monitoring programs, where comparable software identified boundary shifts driven by seasonal rainfall variations. Those findings provided useful benchmarks for interpreting Hampshire results, although direct climatic parallels remain limited.
Future Monitoring and Data Integration
Authorities plan to repeat the full mapping cycle every two years, building a time series that will support predictive modeling of further boundary movements under different land use scenarios. Integration with citizen science records from local walking groups adds another layer of validation, as participants submit geolocated photographs that the software processes alongside professional datasets. This combined approach reduces the interval between major surveys and allows quicker responses when unexpected changes appear.
Conclusion
The application of sophisticated mapping software has provided Hampshire authorities with clearer pictures of protected chalk grassland dynamics, enabling more responsive conservation strategies based on current spatial data rather than static historical records. Ongoing refinements to these tools and continued data collection will support evidence-based adjustments to zone boundaries as conditions evolve.